When to Use
- Reproducible bugs you can trigger reliably
- Regressions where something stopped working
- Performance issues, dropped frames, memory leaks
- State bugs where values are wrong but code looks fine
How to Use
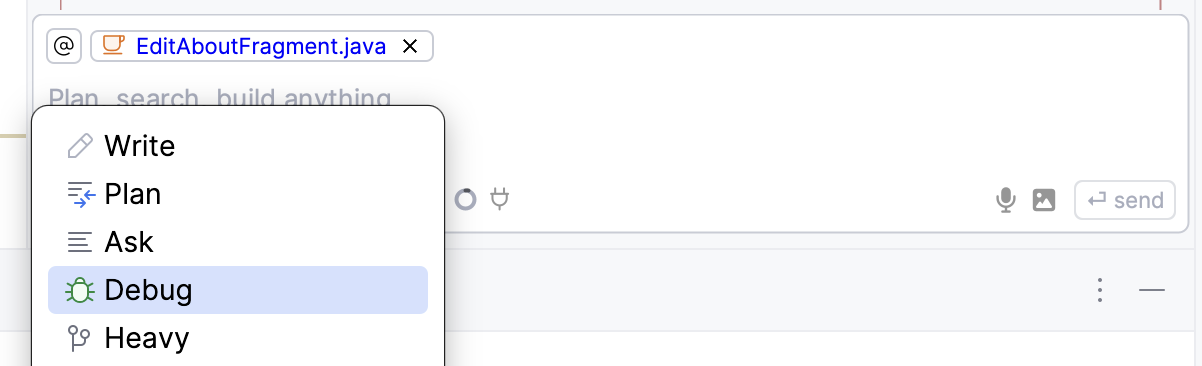
- Select Debug from the mode dropdown
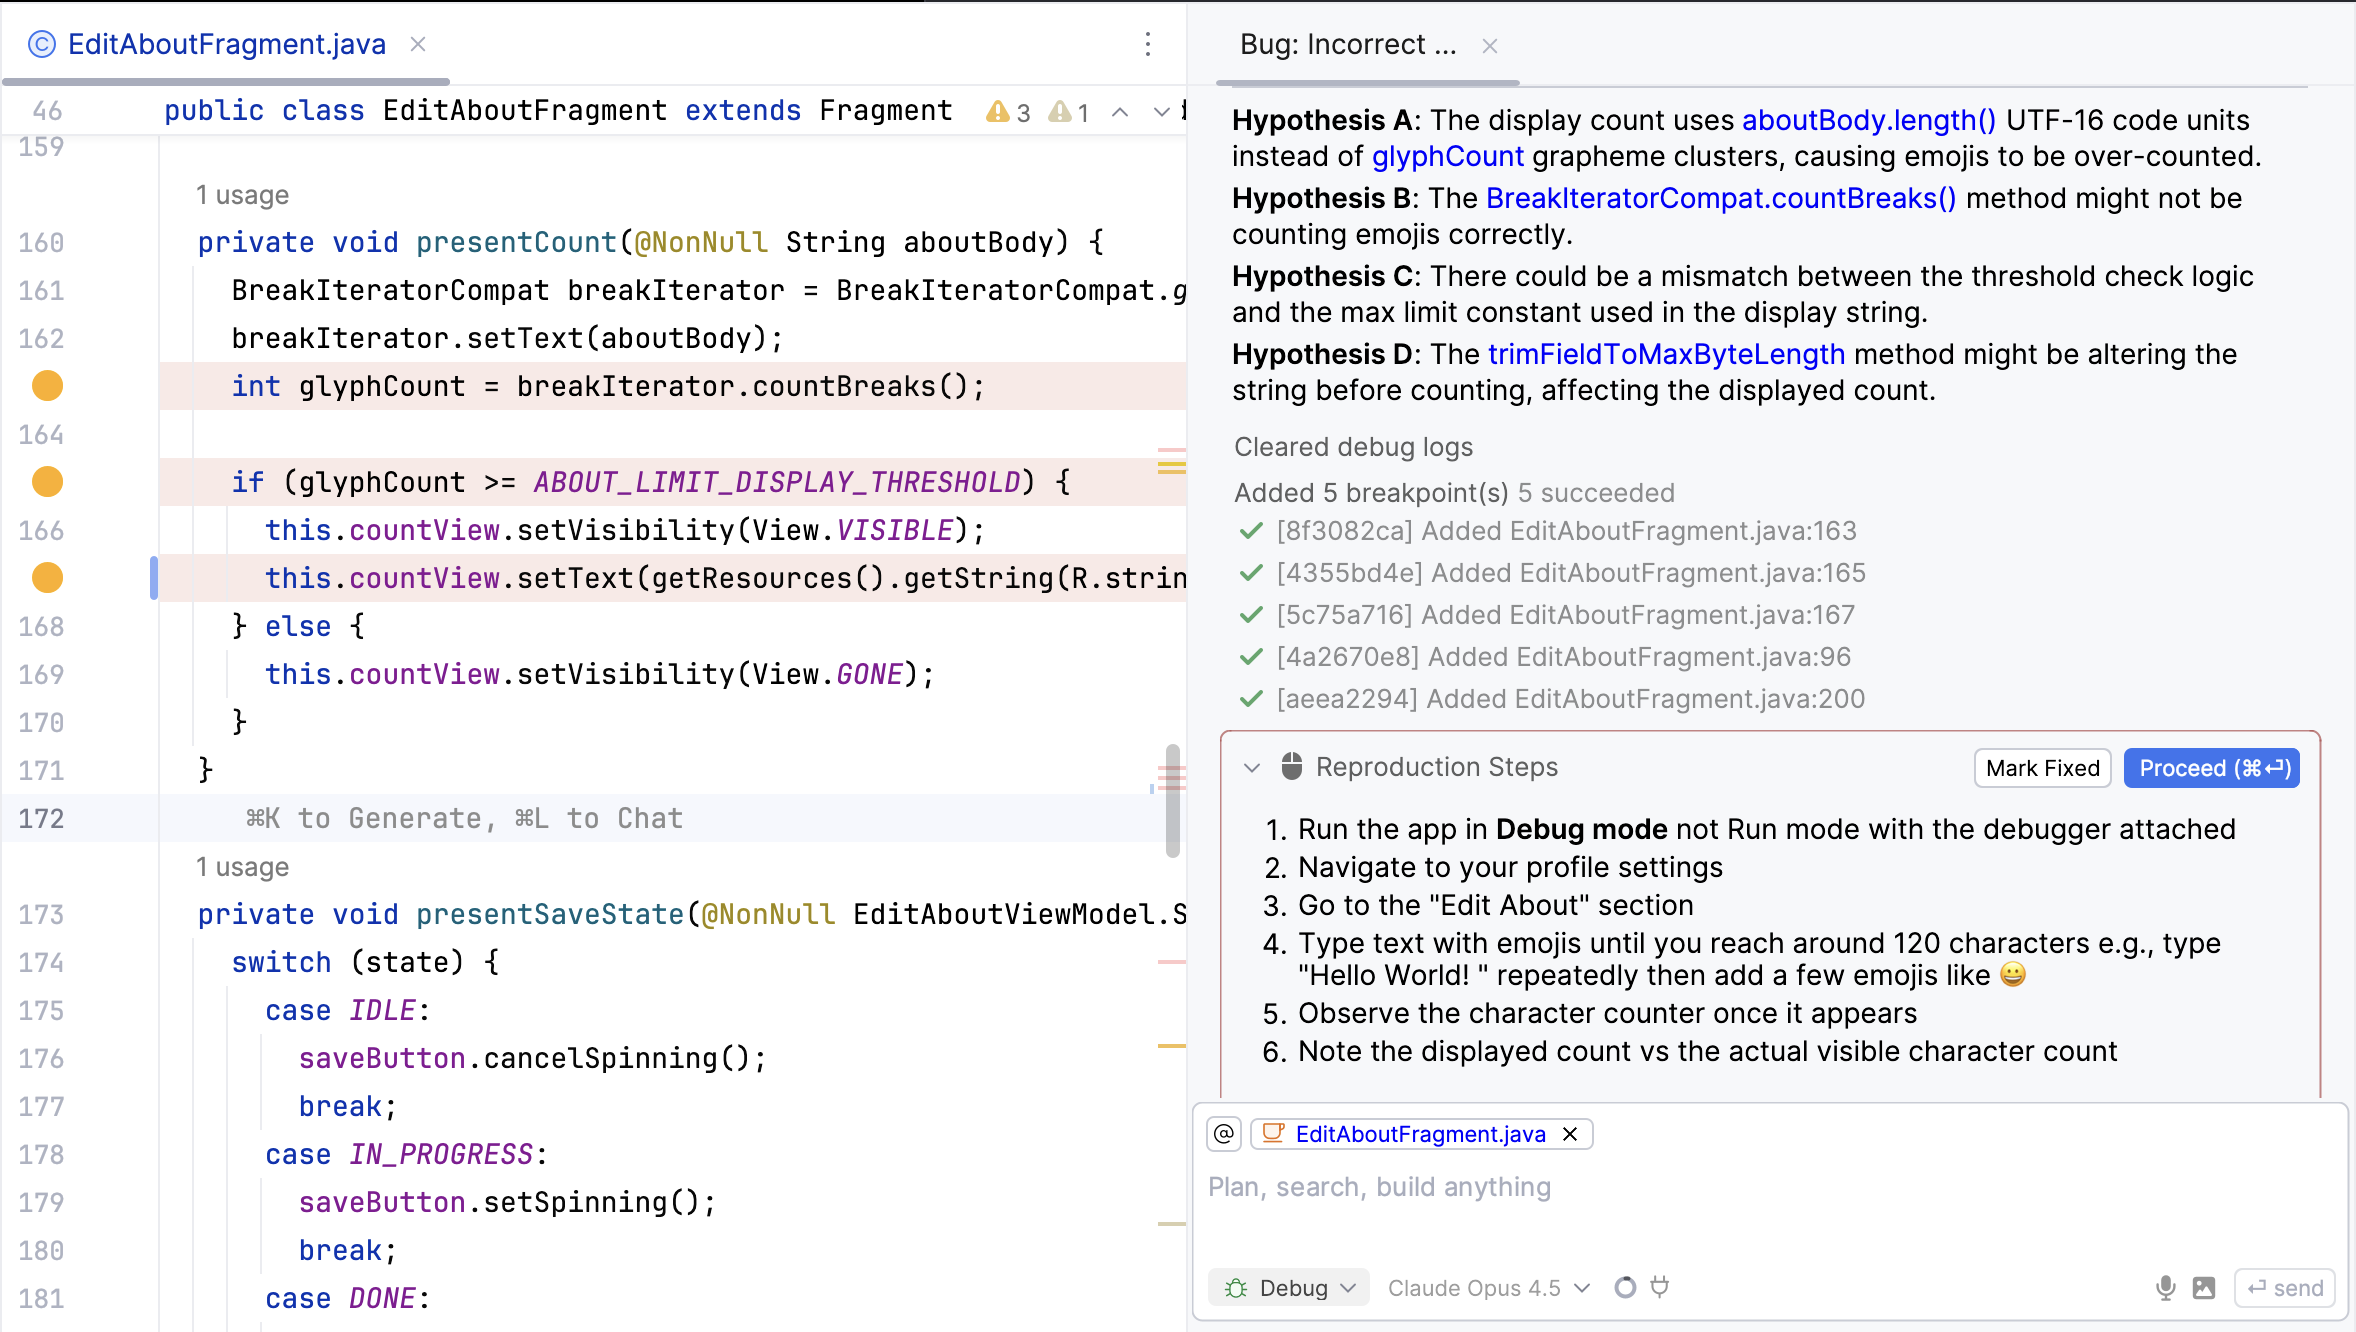
- Describe what’s wrong (be specific about expected vs actual behavior)
- Run your app with the debugger attached
- Follow the reproduction steps the agent gives you
- Click Proceed or add more context via chat
- Click Mark Fixed once verified
Print Logs Mode
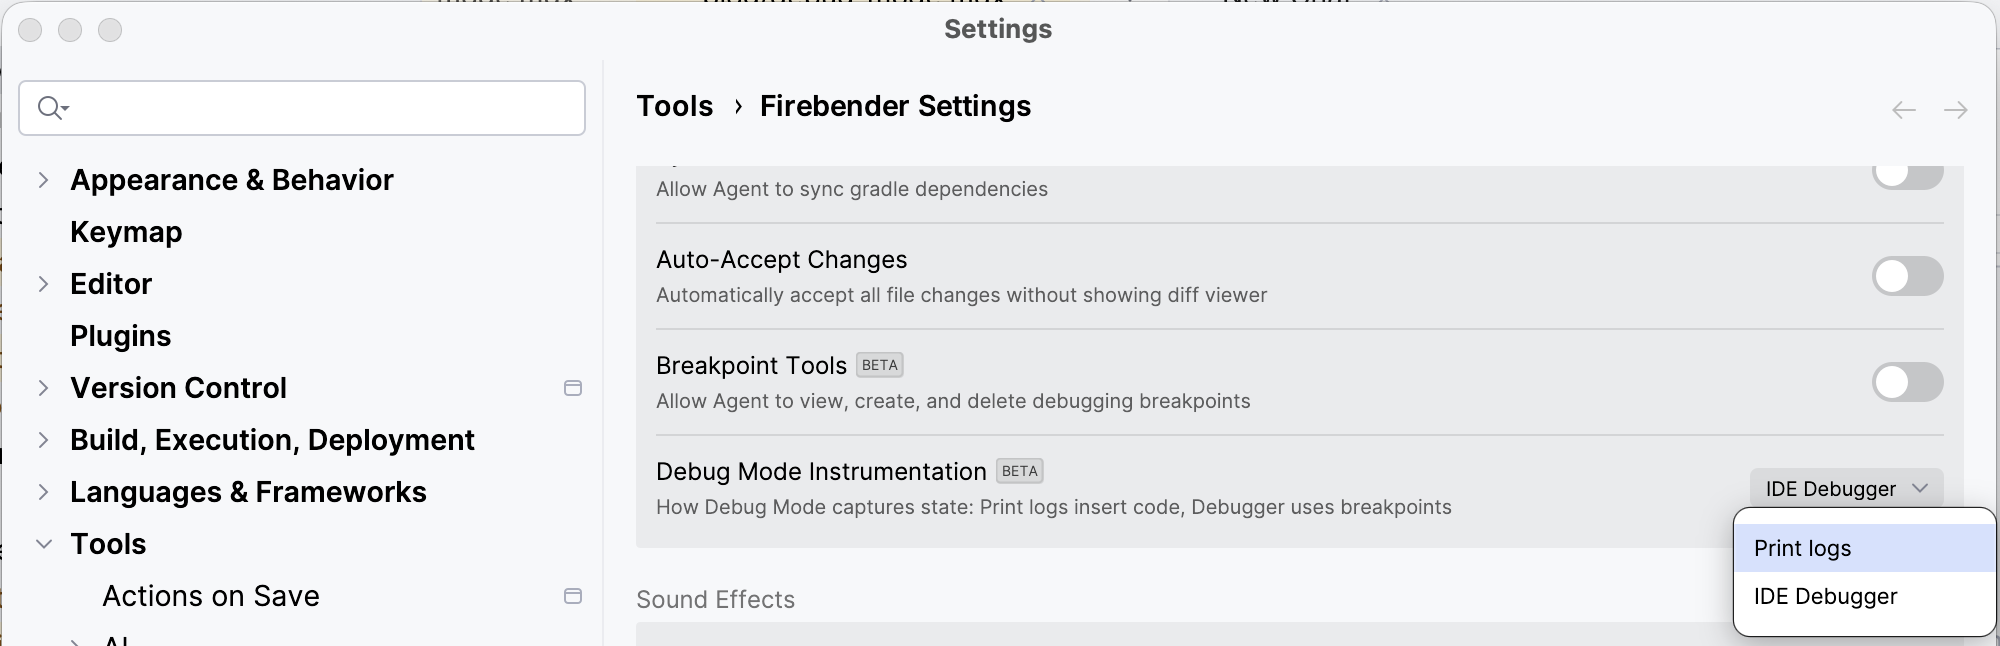
If you can’t run with a debugger, switch to Print Logs mode in Firebender Settings → Debug Mode Instrumentation. This inserts actual logging code instead of using breakpoints.